Tower of London test: bivariate diagnosis on grounds of Speed (Time) and Accuracy scores
The Tower of London (ToL) is one of the most widespread tests of strategical reasoning, problem-solving and mental planning. It is traditionally applied in the field of clinical and cognitive neuropsychology.
Here we provide a Worksheet, ToL Diagnosis Italian Standardization, which makes diagnosis very easy and completely automatic. We refer to the original, 12-problem version of the ToL (Shallice, 1982) which we recently standardized in the Italian population (Bruni, Toraldo, & Scarpina, submitted).
Download the Worksheet
ToL Diagnosis Italian Standardization
![]()
Input data
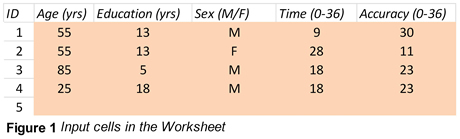
After having administered the patient(s) with the classical, 12-problem ToL version (Shallice, 1982), the clinical neuropsychologist just needs to open the Worksheet (a traditional Microsoft Excel file), and insert the patients’ data in the input cells, which are pink-coloured, as visible in Figure 1. Data from each single patient must be inserted in a row, and five cells need to be filled: Age (years), Education (years), Gender (M or F), Time raw score (0-36, see below) and Accuracy raw score (0-36, see below).
Diagnostic results will immediately be available, with no other action being required (see later).
Up to 100 patients can be diagnosed simultaneously (there are 100 available rows).
[If some
data are missing / mistyped / out of range, a warning message appears on the leftmost column of the Worksheet,
pinpointing the issue to be solved. One exception is the warning “Education
replaced with 8/10”: nothing needs to be done in this case. The message just
specifies that the adjustment of scores for Education is being carried out taking
into account the limits of the normative sample, see Bruni et al., submitted,
for details. ]
[By
“Time” we refer to the original (Shallice, 1982) computation: on each of the
12 problems, 3 points are granted if the correct solution is given within 15
sec, 2 points if it is given within 30 sec, 1 point if it is given within 60
sec, 0 points if it is given in more than 60 sec, or not found at all. The
overall Time score is the sum of the scores throughout all 12 problems
(0-36).]
[By
“Accuracy” we refer to Krikorian at al.’s
(1994) method: on each
of the 12 problems, 3 points are granted if the correct solution is found on
first attempt, 2 points if found on second attempt, 1 point if found on third
attempt, 0 points if also the third attempt fails. The overall Accuracy score
is the sum of the scores throughout all 12 problems (0-36).]
Output - diagnosis
Immediately after having filled the five input cells of a given patient, diagnostic results will appear in the green cells (Fig. 2) and in the plot showing the position of the assessed patient(s) in the Time-Accuracy plane (Fig. 3). Results include the following features, for all assessed patients.
(i) Traditional neuropsychological diagnosis based on the Time score alone. This is reported in the section Univariate diagnoses, Time (left side of Fig. 2). z scores, Equivalent scores, and Percentiles are reported; all these are already adjusted for the effects of Age, Education, Gender, and their interactions.
(ii) Traditional neuropsychological diagnosis based on the Accuracy score alone. This is reported in the section Univariate diagnoses, Accuracy (centre of Fig. 2). z scores, Equivalent scores, and Percentiles are reported; all these are already adjusted for the effects of Age, Education, Gender, and their interactions.
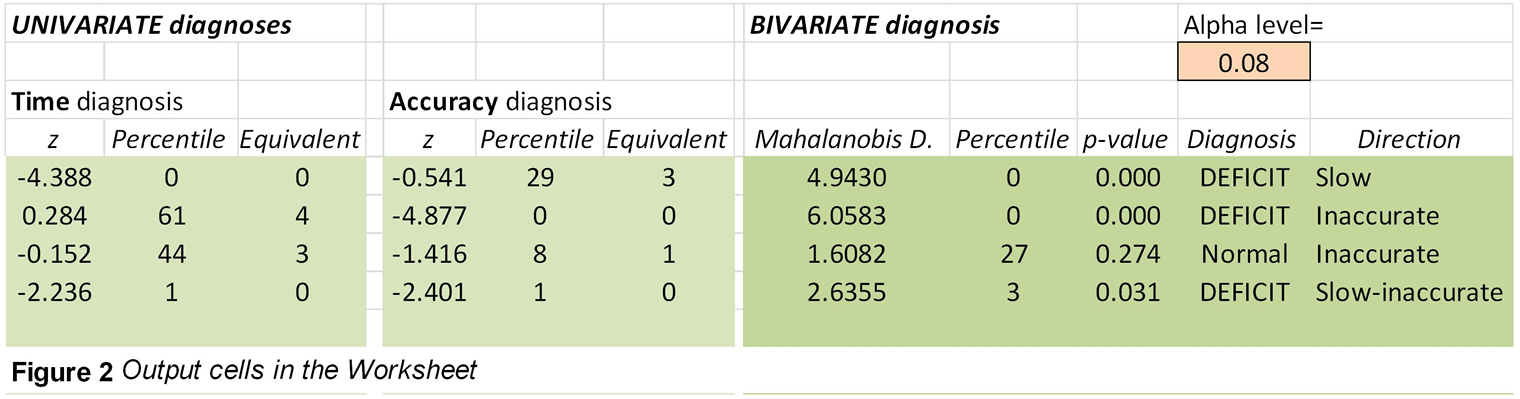
(iii) Bivariate diagnosis, which combines both Time and Accuracy information into a single diagnostic outcome (right side of Fig. 2). Two parameters are given. The first, Mahalanobis Distance, informs the clinician as to how far the patient’s (bivariate) performance is from the mean performance by normal controls, and comes along with percentile and p-value for the abnormality of that bivariate distance. The second piece of information is the Direction in which the patient’s bivariate performance is off with respect to the mean by normal controls – there are 8 possible directions, all visible in the right-side plot of the Worksheet (and shown in Fig. 3 below): Fast but Inaccurate, Inaccurate (but with normal speed), Slow and Inaccurate, Slow (but with normal accuracy), Slow but Hyper-accurate, Hyper-accurate (with normal speed), Fast and Hyper-accurate, Fast (but with normal accuracy). Note that in the Diagnosis column (right side of Fig. 2), the first 5 categories above are collectively referred to as DEFICIT (because at least one sign of impaired performance, i.e. slowness or inaccuracy, was detected), while the last 3 categories are referred to as Above-normal because no sign of impairment, and conversely, some sign of above-normal performance, was detected.
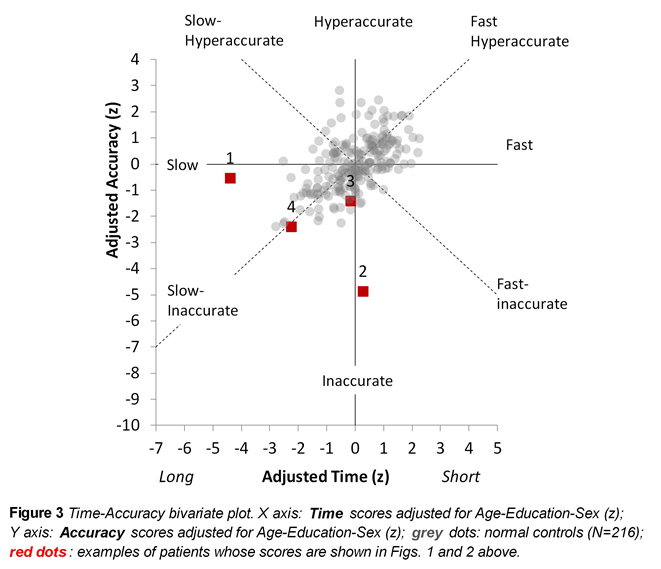
The Worksheet’s bivariate plot (Fig. 3) provides a grasp as to the (ab)normality of the assessed patients’ performances with respect to the distribution of the normative sample. The cloud of grey circles is the distribution of the Time-Accuracy scores by normal controls (both scores are automatically adjusted for demographics, and expressed as z scores). The neuropsychologist will see each assessed patient’s performance as a red square in the plot, numbered after the input row hosting the data from him/her. Thus for instance, the red square numbered “4” in the plot (Fig. 3) shows the performance by the patient in row ID=4 (Fig. 1) and whose diagnostic outcomes are reported in the fourth green row in Figure 2.
It is important to understand that the correct cut-off for bivariate diagnosis depends on whether one wishes to diagnose any kind of abnormality – both positive (Hyper-accurate, Fast, Fast and Hyper-accurate directions in Figure 3) and negative (DEFICIT: the other five directions in the plot), or one is only interested in DEFICIT abnormalities. If the former is the case, the alpha level in the Worksheet’s pink cell T2 (visible in the top-right corner of Fig. 2) must be set to 0.05; if the latter is the case, which is most common in clinical practice (where above-normal performances are not expected or interesting), the alpha level must be set to 0.08 (which guarantees a 5% risk of false positives in the five directions of interest).
Password for accessing the Worksheet codes
If the user wishes to look at the internal codes of the Worksheet (at least, of the version that was published in 2020), single sheets can be unblocked by using the following password: sgrassatore. The authors take no responsibility for the detrimental effects of changes in the code.
References
A paper reporting the ToL standardization we referred to here is currently submitted for publication:
Bruni F., Toraldo A., & Scarpina F. (submitted). Italian normative data for the original version of the Tower of London test: a bivariate analysis on speed and accuracy scores.
Krikorian, R., Bartok, J., & Gay, N. (1994). Tower of London procedure: a standard method and developmental data. Journal of Clinical and Experimental Neuropsychology, 16, 840–850. Doi: 10.1080/01688639408402697
Shallice, T. (1982). Specific impairments of planning. Philosophical Transactions of the Royal Society of London Series B-Biological Sciences, 298, 199–209. Doi: 10.1098/rstb.1982.0082