Measuring and diagnosing unilateral neglect
1. Introduction
Unilateral neglect is a complex syndrome that may be observed in brain damaged patients. The typical case is a patient with a lesion in the right hemisphere whose behaviour witnesses disruption of processing of left-sided stimuli. In spite of decades of clinical and experimental work, there is still little consensus on how unilateral neglect should be measured and diagnosed. Here we do not focus on the choice of the tasks – rather we focus on the statistical procedure that should be applied. Our attempt is towards statistical uniformity in the use of tasks that are diagnostic of neglect.
The vast majority of neglect tasks have the same data structure: patients are administered with some form of stimuli in different spatial positions, and each stimulus is associated with a 1 (Hit) or a 0 (Miss) score.
This data structure does not only characterize the ubiquitous cancellation tasks: a little reasoning will show that many, many other task types have the same structure. For instance, tasks of detection of brief visual (Posner-like), or auditory, or tactile stimuli; haptic search; memory recall tasks in which stimuli can be either recalled (1) or forgotten (0); even fMRI or ERP experiments in which physiological responses can be dichotomized to 0 and 1; etc., in a virtually endless list (see Toraldo et al., 2017, for more detail). Thus we reasoned that a statistical method which is valid for this data structure would automatically be valid for a very large number of neglect tasks, with a strong gain in uniformity.
The product of our efforts is a Worksheet, MPH Neglect Diagnosis, which, given raw data, directly provides a statistically-founded diagnosis of neglect, in the form of a z-score and a p-value.
No control sample is needed: the data from the assessed patient is all that is required (see Toraldo et al., 2017, pp. 1258-59, Section ‘Normal subjects only vary for Hit rate and have no lateral biases […]’, for a full explanation).
2. MPH Neglect Diagnosis 2.1
The software is currently available only for Windows – Excel 2007 or more recent is necessary. We are currently working on a macOS version.
2.1. Downloading the Worksheet
Download and unzip the following file:
The ZIP file contains: the Worksheet (i.e. the Excel document ‘MPHND…’), the Handbook (a PDF file with all the instructions, MPH Neglect Diagnosis 2.1 Handbook) and a number of INI and JPG files which are needed to run some popular cancellation tasks. Read the Handbook file in order to run the program properly.
We often improve the Worksheet – when some significant improvement is implemented, we upload the latest version in this website. The name of the Excel document identifies the exact version it contains. For instance, the file name ‘MPHND-2-1-02-build11’ stands for ‘MPH Neglect Diagnosis, version 2.1.2.11’. It is with the first two numbers (‘2-1’) that we informally identify the software version – currently (February 2019), version 2.1.
2.2. Input
The current version of the software allows the user to insert data from an assessed patient in two main ways: the first holds for cancellation tasks, the second holds for any other kind of task.
(i) If the task is cancellation, one can visualize the cancellation display and simply click on the targets that the patient could detect (or that s/he missed). In the Figure we show the Albert (1973) cancellation display. The examiner clicked on the boxes corresponding to the targets that the patient detected, making them black:
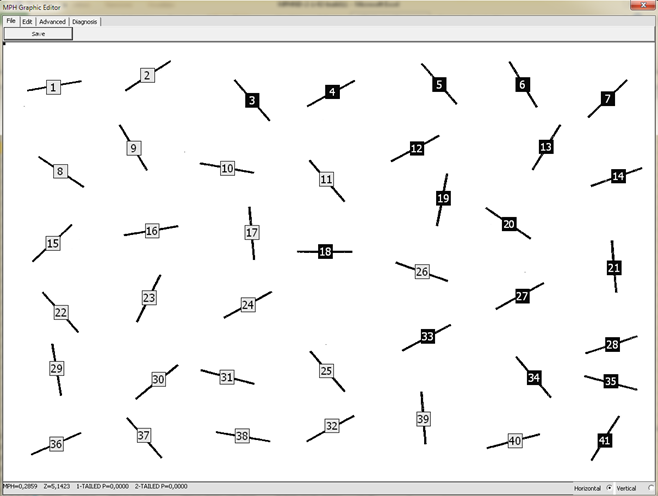
[We were inspired by Rorden and Karnath’s (2010) free Cancel software http://www.mccauslandcenter.sc.edu/crnl/tools/cancel].
(ii) If the test is not cancellation, data can be inserted in a matrix, in which the coordinates (X, Y) of the stimuli, and the Hit/Miss (0/1) scores are to be entered:
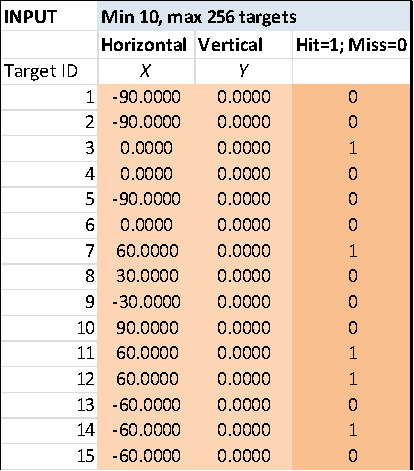
Thus for instance, stimuli might be sounds emitted by speakers in different positions (X = position of the speaker, Hit/Miss = whether or not the patient detected a given sound), or visual stimuli presented on a screen at different times (X = screen positions, Hit/Miss = whether or not each stimulus was reported), or objects in a scene that the patient inspected for later recall (X = position of the stimulus in the study phase, Hit/Miss = whether or not it was correctly recalled), or again, sounds delivered from different speakers while measuring ERP (X = speaker position, Hit/Miss = whether or not the amplitude of some critical ERP component was larger than a convenient threshold), etc.
2.3. Output: MPH and relevant statistics
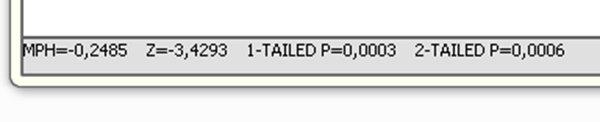
Neglect diagnosis is given in the form of a z-score and a p-value. These are updated in real time, when you are clicking on the targets or inserting data in the matrix. Look at the lower edge of the cancellation display:
…or at the OUTPUT PREVIEW, close to the data matrix:
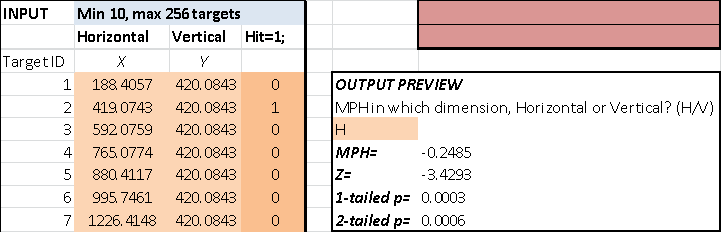
The z-score and p-value are based on a measure of neglect severity, MPH, which a thorough theoretical analysis justifies as optimal (Toraldo et al., 2017). MPH is the Mean Position of Hits – the mean position (in physical space) of the stimuli that were properly processed by the patient (Hits). While MPH per se is relatively easy to compute (the first example we know of is in Binder et al., 1992), the mathematics behind the statistical behaviour of MPH, critical for diagnosing neglect, is much less straightforward. It is for this reason that we developed the mathematical model and the Worksheet.
MPH is standardized in such a way that 0 means no neglect at all, -0.5 indicates extreme right neglect (the patient only processed the leftmost stimulus/i) and +0.5 indicates extreme left neglect (the patient only processed the rightmost stimulus/i). The Worksheet directly visualizes MPH in both dimensions (horizontal and vertical) as a red cross in the field of detected (dark red) or undetected (white) stimuli. The plot is just below the OUTPUT PREVIEW:
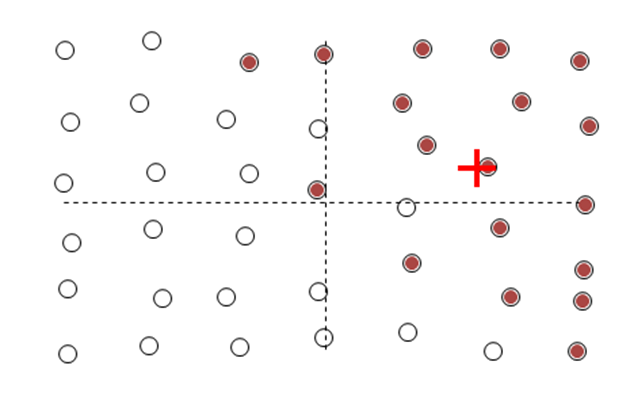
The dashed horizontal axis extends from the left end (-0.5, maximum right neglect) to the right end (+0.5, maximum left neglect); the dashed vertical line extends from the bottom end (-0.5, maximum neglect for the upper part) to the top end (+0.5, maximum neglect for the lower part). The two axes cross at (0,0), which corresponds to absence of neglect in any dimension.
2.4. List of cancellation tasks provided with the Worksheet
Some cancellation displays are provided with the Worksheet; of course the user can implement other cancellation displays if s/he wishes to do so (see instructions in the Handbook PDF file, Section 4.2).
The displays that are provided with the Worksheet come from the following tests: Albert-Line (Albert, 1973), Gauthier-Bell (Gauthier et al., 1989), Weintraub-Letter, Weintraub-Shape (Weintraub & Mesulam, 1985), Diller-Letter (Diller & Weinberg, 1977), Diller-V (Toraldo, unpublished work), BIT-Letter, BIT-Star (Wilson et al., 1987). The first four were downloaded from Rorden and Karnath’s Cancel website (http://www.mccauslandcenter.sc.edu/crnl/tools/cancel). Diller-V is an improved variant of Diller & Weinberg’s (1977) Letter Cancellation task that was developed by one of us (AT) in the late 1990s. In it, there are exactly 9 targets per hemi-row, and rows are equispaced so that the altitudinal component of neglect can be measured more accurately. It is called ‘Diller-V’ because targets are ‘V’ letters (the original Diller test uses ‘H’s). The BIT original displays are not provided with the Worksheet because of copyright restrictions; however, we provide modified displays which only show target positions, so the Worksheet can be used to analyse data from those tests anyway.
2.4.1. Download the printouts and transparencies
If the user wishes to administer a patient with some of the cancellation tests that are provided with the Worksheet, s/he can download the following ZIP file:
This ZIP contains the PDFs of the cancellation displays, which can be printed out on regular A4 paper. Be careful to select the option "Actual size" (i.e. to avoid "Fit" or "Shrink..." or "Custom") in the Adobe printing dialog box, otherwise the printout will be significantly smaller than correct. Other PDFs contain the word ‘transparency’ in their names. These just highlight the positions of the targets and, if printed out on transparencies and overlapped with the paper displays, make the examiner’s search for the targets much easier.
3. Previous versions of the Worksheet
3.1. MPH Neglect Diagnosis 1.0
In the 1.0 version, there was no graphic application, so data could only be inserted in Matrix form.
MPH neglect diagnosis 1.0 Worksheet 20170809 ![]()
MPH neglect diagnosis 1.0 Worksheet Instructions 20170809 ![]()
4. Advantages of the method
The method for deriving neglect diagnoses that is implemented in the present software has the main advantage of providing uniformity (and theoretical foundation) to the statistical procedure used to diagnose neglect. There are other advantages though. First, the method solves the old problem of the arbitrariness of cut-offs in the neglect literature; second, the method solves a (so far) completely overlooked problem of inflation of false-positive rates with the classical diagnostic methods; third, the method does not require a control sample.
While the interested reader can access the Toraldo et al. (2017) paper for extensive explanation, we are briefly giving some more detail as to each of the above points, in the following lines.
(i) Arbitrariness of the cut-offs. Much clinical/experimental work in the past decades has used a fixed difference in the number of omissions between the two halves of the display as a cut-off for diagnosing neglect [e.g., 2 for the Albert (1973) test, or 4-5 for the Diller & Weinberg (1977) test, etc.]. Those limits are arbitrary, based on sheer intuition. The present method overcomes the problem by implementing a proper statistical model which estimates the true risk of false positives, with, in fact, a variable cut-off.
(ii) The overlooked problem of inflation of false-positive rates. The classical diagnostic method, based on a sample of control subjects, can produce inflated false-positive rates (anywhere between 5% and 100%, see Toraldo et al., 2017) because it does not take into account the overall proportion of detected targets in the computation. The present method solves the problem and leads to nominal (e.g. 5%) false-positive rates.
(iii) No need of a control sample. As we could demonstrate on a group of 199 controls performing the Diller & Weinberg (1977) test, normal subjects’ variance in lateral bias is entirely due to within-subject ‘noise’: there are no real between-subjects differences. Since our mathematical model already estimates the within-subject noise on grounds of the performance of the patient, there is no need to test control subjects. Or at least, if the cognitive/attentional demands are similar to those of the Diller task, which are pretty typical, there is no urgency to collect a sample of control subjects. Note that even if there were some true between-subjects differences in lateral bias, these would likely be orders of magnitude smaller than the dominant within-subject noise, so our model would provide a good approximation of the correct diagnostic outcomes anyway.
5. ‘Website Material’
While an extensive theoretical analysis of the features of the MPH measure is reported in Toraldo et al. (2017), many technical details were omitted from that paper. These are provided in the following Website Material file:
6. Work citation: Toraldo et al. (2017)
Please feel free to use and diffuse the MPH Neglect Diagnosis software. If you apply the Worksheet and then report results in any form of published work, please cite:
Toraldo A, Romaniello C, Sommaruga P (2017). Measuring and diagnosing neglect: a standardized statistical procedure. Clinical Neuropsychologist, 31 (6-7), 1248-1267. DOI: 10.1080/13854046.2017.1349181
The paper can be found here: https://www.tandfonline.com/doi/full/10.1080/13854046.2017.1349181
The proofs of the paper can be found here: https://unipv.academia.edu/AlessioToraldo, here: https://www.researchgate.net/profile/Alessio_Toraldo/contributions, and here:
https://loop.frontiersin.org/people/61948/publications.
7. Contact information
For any information not contained in this Website, please email the authors: Alessio Toraldo, alessio.toraldo@unipv.it, alessio.toraldo@gmail.com; Cristian Romaniello, cristian.romaniello01@universitadipavia.it, cristian.romaniello88@gmail.com; Paolo Sommaruga, paolosom@gmail.com.
References
- Albert ML (1973). A simple test of visual neglect. Neurology, 23, 658–64.
-
Binder J, Marshall R, Lazar R, Benjamin J, Mohr JP (1992). Distinct syndromes of hemineglect. Archives of Neurology, 49, 1187–94.
-
Diller L, Weinberg J (1977). Hemi-inattention in rehabilitation: The evolution of a rational remediation program. In EA Weinstein & RP Friedland (Eds.), Hemi-inattention and hemisphere specialization (pp. 63–82). New York: Raven Press.
-
Gauthier L, Dehaut F, Joanette Y (1989). The Bells Test: A quantitative and qualitative test for visual neglect. International Journal of Clinical Neuropsychology, 11, 49-54.
-
Rorden C, Karnath HO (2010). A simple measure of neglect severity. Neuropsychologia, 48, 2758–63.
- Toraldo A, Romaniello C, Sommaruga P (2017). Measuring and diagnosing neglect: a standardized statistical procedure. Clinical Neuropsychologist, 31, 1248-67.
-
Weintraub S, Mesulam MM (1985). Mental state assessment of young and elderly adults in behavioural neurology. In: MM Mesulam (Ed.), Principles of behavioral neurology (pp. 71-123). Philadelphia: Davis Company.
-
Wilson B, Cockburn J, Halligan P. (1987). Behavioral inattention test manual. London (UK): Tames Valley Test Company